Telltale is a research project Density Design is managing along with Politecnico’s DIAP (Architecture and Urban Planning department) and DEI (electronic and informatics department). Telltale started in 2012, the general aim of the project is to disclose and expose emerging issues, discourses, and uses of the cities of Milan and New York observing and visualizing the digital traces coming from the direct experience of people who live in it, visit it or just pass through it. Recent technological development and the emergent participation of internet users in terms of social interaction are leading us towards a redefinition of the possibilities of gathering and sharing first-hand information: today citizens produce and share public information about their everyday experiences and they actually do so, mostly using social networking services and website, such as Twitter, Facebook and Foursquare.
Telltale final output will be an intuitive and easy-to-use platform able to import, analyse and represent those novel information and integrate them with more consistent data sources on cities; we expect this platform to support and improve policy-making practices and to provide all the stakeholders with new insights about their city. The platform will provide users with pre-selected explorable “views” we will provide according to researches and preliminary experiment we are conducting, and with a quick and intuitive navigation system.
– Shading some lights on the process:
– Data gathering / The project relies on a scalable software framework that is used to acquire information from heterogeneous digital sources. A general source of digital information can be viewed as a collection of acquirable facts. Those facts are characterized by one or more dimensions (e.g. geo-location, date and time) or attributes (e.g. users, or propositions expressed), identifying each of them in an unambiguous manner. At the current state of the art, since we are mainly interested in User Generated Contents, we acquire and store heterogeneous facts from four different social networks: Twitter, Foursquare, Flickr, and Instagram. Furthermore, we decided to narrow down the acquisition, up to now, to facts concerning the cities of Milan and New York.
– How to interpret Social Media Data / As we higlighted, there is growing interest, across a wide range of subfields in urban studies, in considering the role played by the new location-based media and, simultaneously, in the impacts resulting from the increasing availability of urban digital data from different sources. This fragmented proliferation of information generated by inhabitants and city users requires an evaluation of the potential benefits for the research community and for urban decision makers, which can be obtained by using these data for generating broad and analytical visions on urban spaces uses. One of the goals of the project is also to design a methodological framework that defines how to extract urban knowledge from geo-referenced Social Media Data starting from a deep understanding of the very nature of such information (e.g. why users share, post, check-in, tweet; which kind of people are actually using social media; how to interpret collective clusters of contribution).
During past months we’ve been working with Social media experts and made some researchers investigating the peculiarities of Twitter’s, Foursquare’s, Instagram’s and Flickr’s users’ sharing behaviors in order to enlighten which specific urban issues would benefit from an analysis based on these media. We were then able to select certain urban issues (main area plus specific concerns)worth to be investigated through these data according to the 4 geo-social applications’ characteristics (sharing behaviors, relation with places, available metadata from the API).
– First experiments: sketching with data / A first experiment has been conducted on Milan and been exhibited on the International Tscingua exhibition, helping us understand how to process data and select some specific visual models able to represent time-trends and aggregations of similar contents.
This poster represents a 3 weeks (21th August – 9th Sept 2012) period of urban analysis through the popular Social Network Instagram on the city of Milan, Italy. The maps show the evolving quantity of Instagram pictures taken from each Milan district. Districts are represented according to the novel PGT (2010 Territorial Government Plan) definition of NIL (Local Identity Nucleus): which reshaped the former neighborhoods’ administrative boundaries. Â New edges are defined by a clustering of activities, centralities and public services availability for each area. The central trends part represents the most used digital filters that have been used within the period: Instagram diverse filters are used to emphasize saturation and contrasts, to give a “past” flavor to the pictures or to shift pictures colors to different palettes. Top users and the number of pictures for each one is represented as well.

This poster represents a 3 weeks (21th August – 9th Sept 2012) period of urban analysis through the popular Social Network Twitter on the city of Milan, Italy. “Tweets” are more and more geo-localized, so a bunch of urban investigation such as contributions’ distribution through space and time, user profiling and content analysis on different areas seems incredibly promising. Our analysis tried to understand if it’s possible to reveal insights on the composition and spatial distribution of Milan Twitter population through time. The maps show the evolving quantity of Twitter contributions coming from each Milan NIL. The central trends part represents the most “Twitter spoken languages” in Milan within the whole period. Top users and the number of contributions for each one is represented as well.

This poster represents a 3 weeks (21th August – 9th Sept 2012) period of urban analysis through the popular Social Network Foursquare on the city of Milan, Italy. The maps show the evolving quantity of Foursquare check-ins for each Milan NIL, trying to understand if it’s possible to describe city areas according to the patterns of check-ins they reveal.The central trends part represents the most checked-in categories of places in Milan within the whole period. Top users and the number of check-ins for each one is represented as well.
– Ongoing experiment / Urban Stories Urban Stories is an attempt to visualise spatial patterns of individual uses of the city through geo-referenced tweets. Urban Stories relies on geo-referenced public Tweets gathered from Twitter API’s (link https://dev.twitter.com/terms/api-terms) and focusing on the area of the Municipality of Milan, from February 23th to March 23th, 2013. The experiment shows tweets from 2313 active users that enabled the geo-localize service on Twitter and tries to unveil movements of individual users through the city. The visualisations show the chronological connection between singular tweets during the time periods, Each line represent a “supposed” path connecting consequent tweets from the same user.
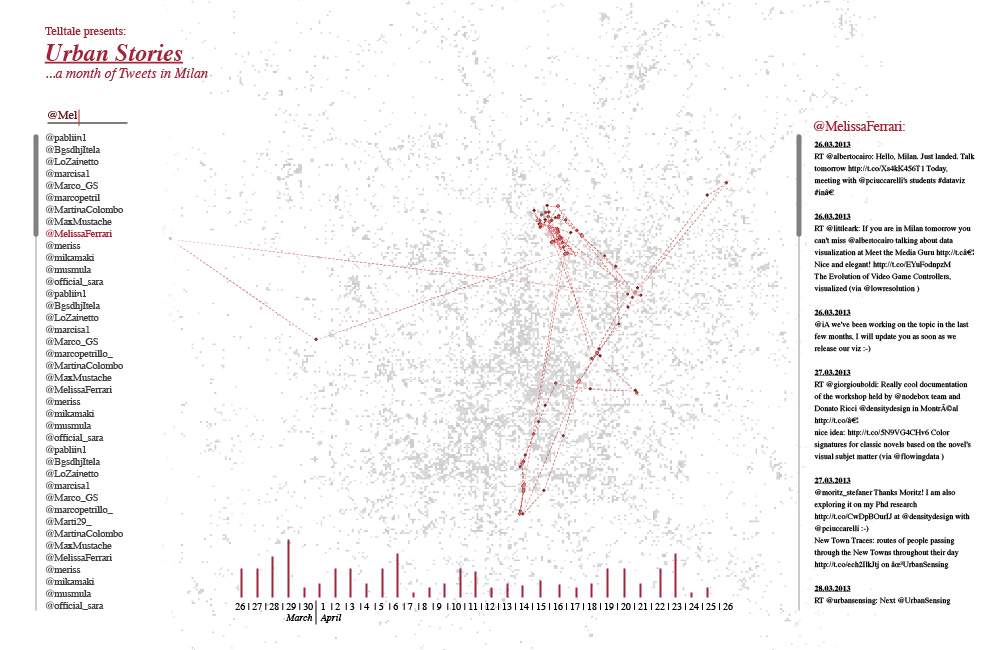
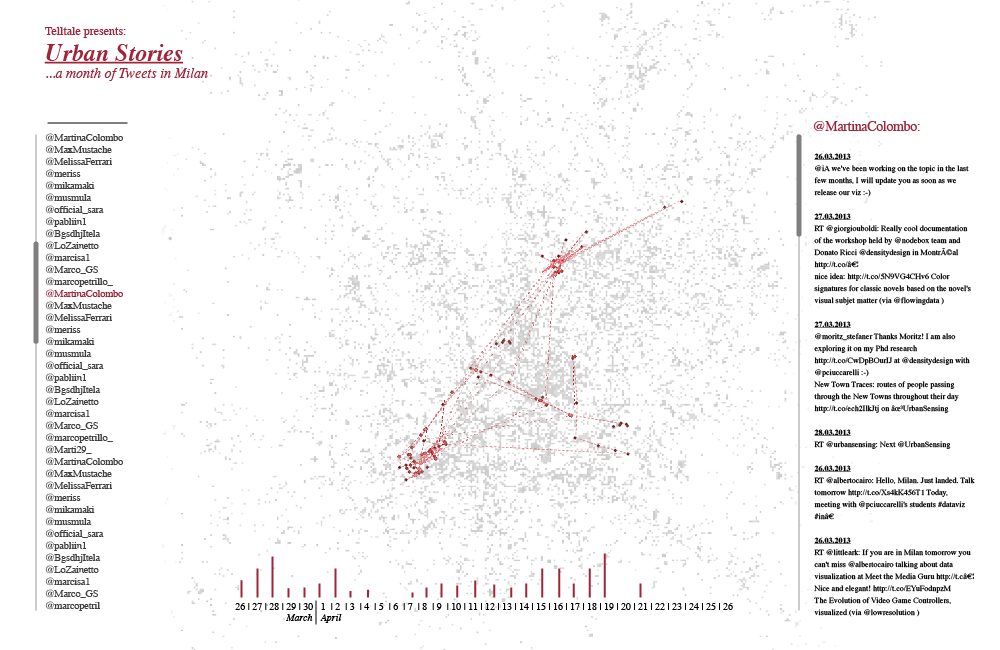
– Scenarios / City usage intensity and rhythm change in time and in space. It is the result of different daily practices carried out by temporary urban populations, that are difficult, if not impossible, to grab through traditional analytical tools, usually available for geographers and urban planners. Recognizing and mapping the places that are “meaningful” for an individual, in their spatial and temporal dimensions, could be a major achievement in the understanding of contemporary city dynamics for urban studies and for urban planning. The experiments carried out in the present project go exactly in this direction and represent a promising and innovative research field that could provide the urban planning community with new insights on urban dynamics.
By visually describing the temporal rhythm of spatial behaviors and spatial movement patterns, we identify four main scenarios of use for Telltale:
a) providing urban planners, transportation authorities and traffic engineers with meaningful data useful to refine citizens’ spatio-temporal behaviors, bringing new perspectives on decision making and policies building at least for the specific target population using social media;
b) supporting the exploration and the generation of new questions about the city, by the use of an interactive web platform, where visualizations are conceived as a built-in part of the investigation process, capable to grasp the attention of city’s stakeholders, while stimulating the dialogue about its current state and stretching the imagination on its future;
c) contributing to the definition of new sustainable urban indicators capable to intercept current urban dynamics, in a faster, less expensive and unobtrusive way, boosting Milan to become one of the first pioneering cities in a cutting-edge experimentation;
d) helping decision makers, planners and designers to discuss and share research findings through visualizations conceived to be coupled with languages commonly used to communicate urban plans and accessible to the non-expert public.