For the second time Greenpeace UK commissioned DensityDesign an infographic, this time for a report on McKinsey’s Marginal Abatement Cost Curve (MAC).
The MAC curve is a bar chart which describes a set of different options available to reduce carbon emissions. MAC curves are a succession of different steps, each one being a different potential measure, with its height representing its cost and its width representing the amount of carbon abatement it could deliver.
MAC Curve issues
There are, though, some issues with McKinsey’s curve.
First of all, McKinsey has never been transparent about the data and assumptions used for the curve calculation. That is, there has never been any scientific peer review of any of the calculations made to draw the MAC curve.
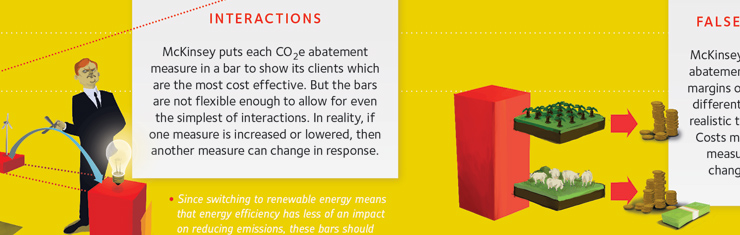
Secondly there are issues about the underestimating or overestimating of certain measures represented in the curve.
The MAC curve suffers of oversimplification of the representation of an economy, as it doesn’t take in account many of the interactions and evolvements of an economic environment.
For a deeper analysis of these and other issues Greenpeace has made available the full report about the MAC curve and its impact on REDD policies.
The design process
Just like the last time we worked with Greenpeace we followed the same design process. In fact, this time too we worked closely with Greenpeace by sending them a structural sketch of the visualization, showed in the image below.

This schematic was then sent back to us by Greenpeace, with annotations about changes, ratings, and order of the various sections. This time, much more than the last one, changes have been radical: Greenpeace wanted the MAC curve to cover the whole spread while other details work as “reading guides” to the curve.

You can check out how the full process works in the project page of our previous collaboration with Greenpeace.
The final artwork
Greenpeace highlighted some issues of the McKinsey’s curve and we decided to represent each of them with an illustration able to convey the message contained in the description boxes. In the top part of the visualization there are the three main reasons why the McKinsey’s Marginal Abatement Cost curve is not a reliable tool while in the main section of the map a few examples columns are highlighted in the graph. The connection between the curve graph and the illustrations is strengthened by the representation of a three dimensional column in each of the illustrations.

The visualization has been included in the Greenpeace report about McKinsey’s MAC curve and its effects on REDD (Reducing Emissions From Deforestation And Degradation) which can be downloaded from their site.