Archive for the “Design” Category

Project progress report 01. Economic statistic & Communication Design

Thursday, October 30th, 2008

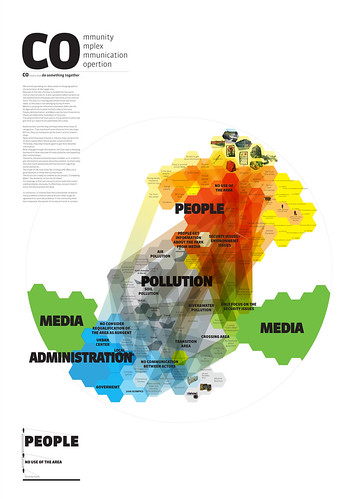
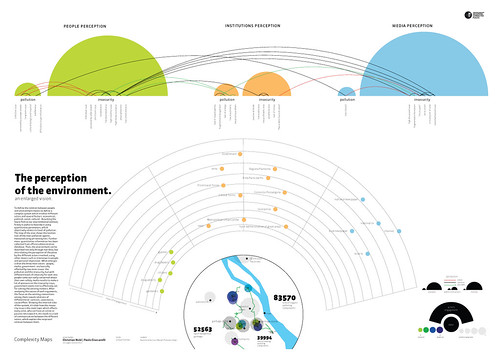
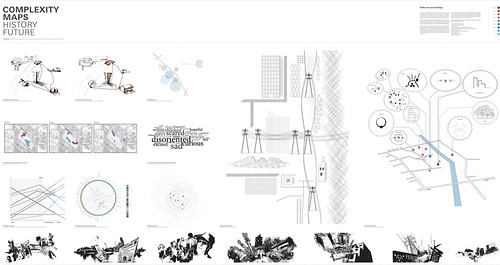
Economic statistic concerns understanding complex, multidimensional, ambiguous and dynamic phenomena building formal representations (models) based on statistical data. Communication Design addresses complex phenomena to interact with them building multi-dimensional visual representations based (in some cases) on statistical data.
The DensityDesign Lab approach, partially modified despite past editions, tries to foster this alliance in order to explore socio-economic phenomena that present both representational and visual problems. In fact they could be:
complex;

* multidimensional;
* dynamic and evolutionary;
* not numerically measurable if not qualitatively;
* ambiguous and fuzzy;
* not dichotomous;
* of great impact on people and society.

The goal is to contribute to the construction of representation and visualization model respecting and preserving the inner structure of the analyzed phenomena, allowing users to know (see) them as a whole. This is not primarily a design issue, but an epistemological one; the aspect of visual representation and communication is only one part of a bigger topic. The broader aim is helping in build a cognitive process that integrates and combines different disciplines and skills.

Numbers & Statistics, Biases & Emotions

Sunday, October 26th, 2008

27 August 2008
Michael Bond
http://www.newscientist.com/article/mg19926711.500-how-to-keep-your-head-in-scary-situations.html

This has led Slovic to suggest we need to imbue statistics with more emotional significance so that we take them to heart. “We learn how to deal with numbers from a young age as cold or abstract entities – to read them, add them, multiply them – but we don’t learn to think about how they represent reality in a way that conveys feeling and meaning. We need to think how to teach people to step away from their intuitive response, which is insensitive to magnitude, and think more carefully about what numbers represent.” […]

MURMUR – Call for Collaborators

Wednesday, October 22nd, 2008


Density Design Lab, Knowledgecartography.org and ovrflw, under the nom de plume Writing Acamenic English, are proud to annouce that Murmur is one of the selected project for VISUALIZAR’08: DATABASE CITY.

How to laugh at design failure!

Monday, October 6th, 2008

During any design activities a lot of ideas fail and it is very difficult to understand how and why it happened.
The Mister O comics strip by Lewis Trondheim lead me to reflect on the experience of failing and to consider how to learn from it. Using the irony of this language it is possible to step forward the personal involvement and clearly ponder upon these situations we, as designers face every day.
I was so excited about this theme that I suggested it to a student as a subject for a final master thesis. He refused, of course.

Changing the change Paper

Friday, September 26th, 2008

HANDLING CHANGES THROUGH DIAGRAMS
To change towards a more sustainable development could means to make decisions not only with a systemic approach, but also to be able to decide in the right time: the density. It seems that, when the discipline of Design integrate a systemic approach with the competences of designers in visualization, it can cope with dense situations, providing effective artefacts – diagrams – to improve the decision process and making profit from the richness of complexity.

Torino World Design Capital – Designing Connected Places Summer School – Complexity Maps

Sunday, August 3rd, 2008

About Complexity Maps
Torino is a city on the move. The tradition forms of representation are obsolete or inadequate to depict the current reality and the dynamics in progress. How can the city be made legible and comprehensible, understood as a complex organism and as a web of physical and social networks? The urban territory is a system whose complexity is growing, in which a multitude of tangible and intangible flows (people, goods, information) stratify and interconnect.

Output
Environment Group
Environment

Environment

Main Research Conclusion:
The lack of communication between different kinds of actors (people, media, administration) overshadows the environmental and pollution problem of the project area.

History / Future Group
History and Future

Main Research Conclusion:
In the past social systems like the illegal allotments kept the connections between local actors alive. The place has been disconnected through top down design actions.

Mobility Group
Mobility

Main Research Conclusion:
The current use of the park has been entirely determined by the a series of external factors that suggest its future dynamics

People Group
People

Main Research Conclusion:
The locked loops of local policy and money perpetuate a situation of local abandonment which feeds illegal activities and social & political exclusion.

(In)Security Group(In)Security

Main Research Conclusion:
the perception of safety in the area changed between 2003 and 2008

Densities Hospital system map

Friday, May 16th, 2008

The Hospital system map “From client to patient” introduced by… more

Election Day

Sunday, April 13th, 2008


election day
, originally uploaded by densitydesign.

Density Design (GS+DR) is returning officer and secretary in one of the polling station during the italian election day 2008.
The compulsive obsession for graphs and diagrams led us to draw this…

Infrastructure System | Spactio

Tuesday, March 4th, 2008


Infrastrucute System | Spactio
, originally uploaded by densitydesign.

Spactio as presence in territory, such as the need to make their voice heard; as acronym of Society for Action who must undergo decisions taken far away from him.
Spactio is a project of Federconsumatori which aims in involving citizens in decisions concerning the construction of new infrastructure. Instead of being passive part, thanks to Spactio tools, now citizens can create a way to enter to the decision-making table bringing their proposals.

Infrastructure System | Fedora

Tuesday, March 4th, 2008


Infrastructure System | Fedora
, originally uploaded by densitydesign.

“In the center of Fedora, that gray stone metropolis “, there is a multitude of crystal globes. Inside each crystal globe you can find a different figure, a fine model about a conceivable metropolis.
Fedora project means to show thinking diversities, questions, troubles and each possible hypothesis while we plan an infrastructural project. Fedora belongs to our social world: it is sharing information, it is our memory.