Hi there! IÔÇÖm Giovanni and with this post I would like to officially present the final version of Borders, my master degree developed within Density Design in particular with professor Paolo Ciuccarelli and the research fellows Giorgio Uboldi and Giorgio Caviglia (at time of writing PostDoc Researcher at Stanford University).
Since the beginning the idea was to create some visual analysis of cinema and everything related to this industry but the first question that came out from our minds was, what can we actually do on this topic? what can we actually visualize?
During the past years Density Design made some minor projects on this topic ( link #01, link #02) and, if we try with a simple research, we can easily find lot of attempts on the web, the problem was that all the projects we focused on had limitations. Most of them relied on small datasets or did not answer any proper research question and, above all, none of them showed the relevance of film industry and how it affects society and social dynamics.
Fascinated by some maps I had the chance to see during the researchÔÇÖs months, I started to think about a way to visualize how cinema can make countries closer, even if they donÔÇÖt have a proper geographical proximity. Basic idea was that in the film industry there are thousands of share production and collaborations, between actors for example, or directors, or companies and what we could actually try to do was to visualize this collaborations and to make it clear with new maps.
After a long process of revisions of our goals and research questions, we decided to focus on the relevance of the film industry inside of society during the last century, using online collected data related to this topic to visualize the evolution of relations between countries during time. Aim was to use cinema a key to read society using the dense network of collaborations inside of this industry to generate new proximity indexes between countries and, starting from them, to create new maps which can show the economical and political dynamics inside of ÔÇťHollywoodÔÇŁ and a sort of new world based on how the film industry developed relations and connections in the last 100 years.
After decided what to do, second step was to find enough data to build up a relevant analysis. There are lot of platform where you can find informations about movies, such as Rotten Tomatoes and IMDB. We selected two main sources for this project, the Internet Movie Database and Wikipedia, both of them are based on user generated content giving us the chance to actually see how movies penetrate into social imaginarium and global interest.
The first one got our attention thanks to an open subset of the whole archive (link) which contains data about more than a million of films and gets an update every six months (more or less), the second one could give us the possibility to analyse this industry in different cultures and linguistic versions and, thanks to its APIs and the related DBPedia portal, it is basically a huge container of meta-data related to movies.
INTERNET MOVIE DATABASE
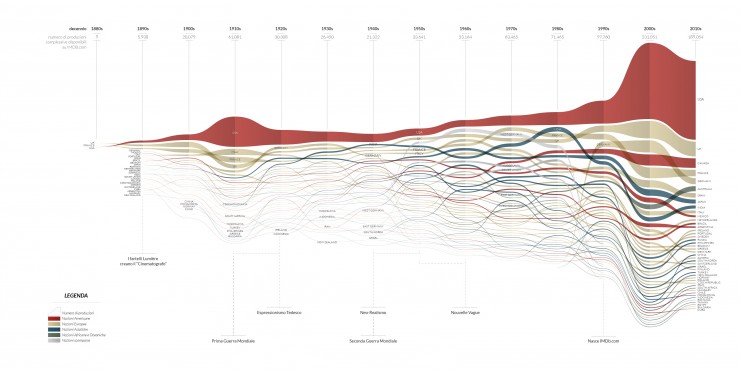
Starting from its huge archive, we decided to focus on that kind of information which can give back some kind of economical and political aspect, we selected 4 specific datasets:
– Locations (all the locations known, film by film – 774.687 records)
– Companies (all the companies involved in the production, film by film – 1.632.046 records)
– Release Dates (for each film all the release dates in each country – 932.943 records)
– Languages (list of languagesÔÇÖ appearance in each film – 1.008.384 records)
After a huge cleaning process (god bless who invented Python) I proceeded to generate that proximity indexes I mentioned above. The process is intricate but basically really easy, all the indexes are created counting how many times movies of a country have a connection with other countries. For example, a value of proximity between France and Germany is the amount of time that inside of French movies’ production there have been involved German companies, or total amount of locations made in the German territory. What I did, for each one of the four dataset we selected, was to calculate this index for every possible couple of countries (200*200 countries circa) with the idea of using it later in Gephi (network generator software) as a ÔÇťedges weightÔÇŁ between nodes (nations).
IMDB – LOCATIONS ANALYSIS
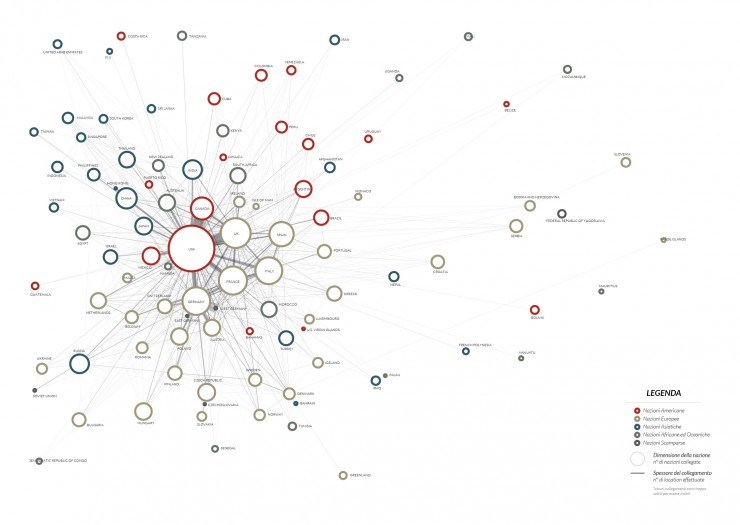
ÔÇťWhereÔÇŁ a shot is taken is a choice that depends on various causes, two of them are costs of production and the requirement to move to a specific place according to the filmÔÇÖs plot. An entire cast move to a different location to follow the filmÔÇÖs theme which can require specific place and sets or to save on productionÔÇÖs costs moving to places where, for multiple reasons, it results cheaper.
Analysing the whole list of locations recorded on IMDB, the aim is to visualize which are the countries that take advantage from these dynamics and how nations behave differently in this process of import/export of shooting.
At the same time, using the same information, an additional analysis on individual countries can be done, we can visualize the percentage of locations made in a foreign country related to the total amount of locations recorded in the archive and see how different nations behave differently (next figure) or, for example, consider only one nation production and see where it has made some location around the world generating ÔÇťindividualÔÇŁ maps.
IMDB – COMPANIES ANALYSIS
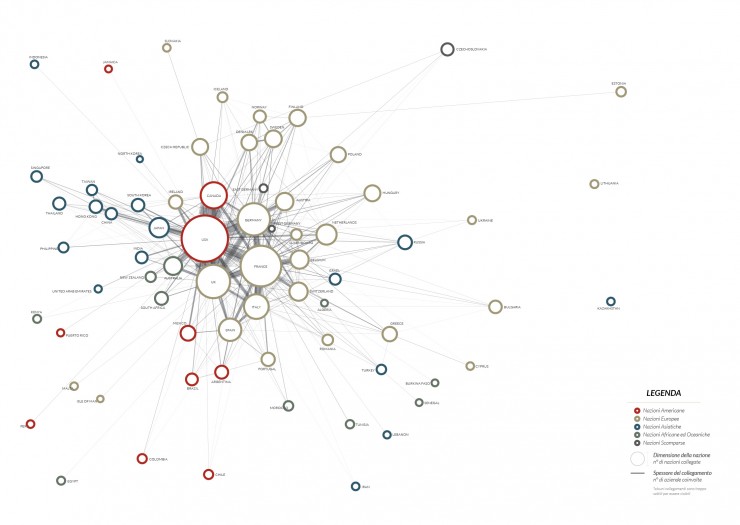
A study on collaborations between national productions and different companies shows again a sort of economical side of this world. The most interesting part of this analysis is made by a network of countries more or less attracted to each other according to a value which is a count of times that a particular connection occurred (for example amount of time that Italian movies involved Spanish companies). As we see in the next figure this network is dominated by western and economically better developed countries, it basically shows importance of a national filmÔÇÖs industry within the global production.
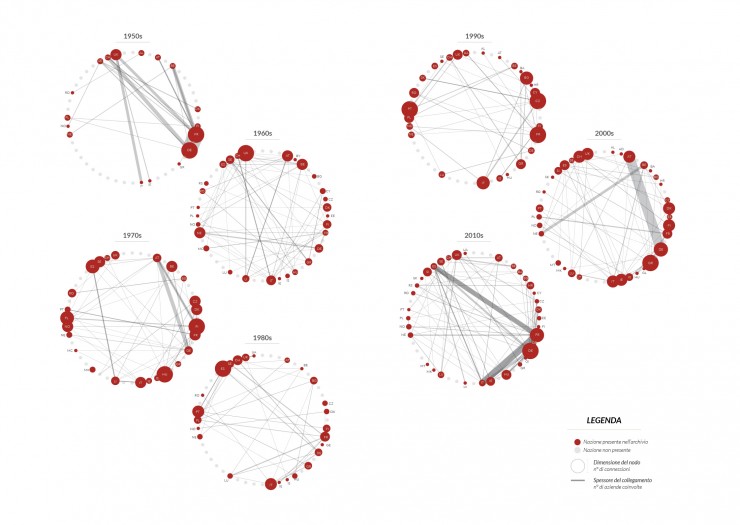
At the same time itÔÇÖs interesting to focus on smaller economic systems and geographic areas, showing the historical evolution of inner dynamics. In the next figures we can see how the situation in the European continent has evolved and strongly changed during time:
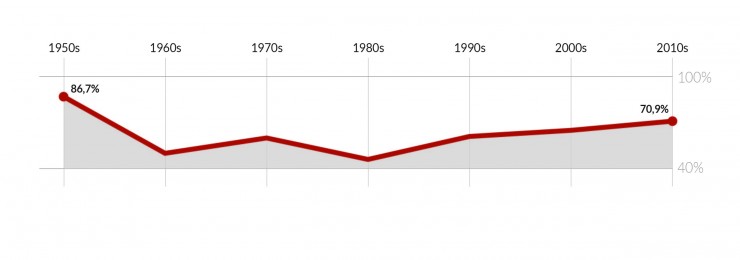
And how the situation changed in a single country such as Canada, showing the percentage of Canadian companies involved in the production decade by decade:
IMDB – LANGUAGES ANALYSIS
Our opinion was that themes debated within a national filmÔÇÖs production are strongly connected to the history of the country and to events in which the nation itself has been involved in. Therefore a strong appearance of a foreign language in the moviesÔÇÖ dialogs of a specific country could represent a sort of link, a connection between different cultures and nations considered.
A bipartite network show us in the next figure how countries and languages arrange themselves mutually, according to connections between them, generating new clusters and showing relationship developed during time. ItÔÇÖs important to point out that, to highlight this feature, within the network has not been considered the link between a nation and its own mother language, obviously this value is numerically much bigger than any other connection and should force the network into a not interesting shape.
IMDB – RELEASE DATES ANALYSIS
In this case, available data revealed itself as messy and confusing compared to the previous ones, tracking  release dates of movies in different countries is not easy and it shows another peculiarity, in the IMDB archive we can find complete data regarding most famous and biggest productions but at the same time, data regarding small national systems and less important movies are incomplete or not significant.
To develop a correct analysis of the global moviesÔÇÖ distribution phenomenon it was necessary to take a step back and base it on a reliable set of data. Specifically we decided to focus and analyse distribution of American movies around the world, indeed into the database they are quantitatively much more represented than the other countries and related release dates are better recorded. Furthermore we decided not to evaluate data related to TV programs and TV series, which follows different and specific ways of distribution.
We thought that the better way to verify potential trends during time of this particular aspect was to visualize in each decade how many American movies were released in any other nation and how far (days of delay) from the American release date, generating a sort of economic and cultural detachment between United States (which can be considerate as leading nation) and any other country. Supposition is that a movie is released earlier where there is more interest and therefore more chance to get a gain from it, the visualization shows how the process of distribution got faster decade by decade, from the 80’s when American movies were released in other countries after at least 6 months (average delay), to the present when Hollywood movies are released almost everywhere around the world earlier than 3 months after the american premiere.
WIKIPEDIA ANALYSIS
What we did in this last paragraph was to verify how films of each country are represented on the different Wikipedian linguistic versions through related pages, what we wanted to do was to verify the overall interest on national productions evaluating their amount of pages on each Wikipedia.
To collect necessary data we used both DbPedia (dbpedia.org) and the encyclopediaÔÇÖs APIs, what we did was basically to count on every Wiki version how many movies of every country are represented with a proper page, using this value (combined with the Page Size) to create a proximity index between nations and to generate a bi-partite network and some minor visualization.
Since all the sources where the data come from are based on user generated content, what we see in these visualizations is an image of global interest in cinema rather than a visual representation of an official productions database. It could be interesting to repeat the same process on some kind of “official data” and see what are the differences between the two version.
What we have is a sort of thematic atlas which can be developed on many other different kind of data (music, literature..) while keeping its purpose, to be an observation of society (and its global evolution) trough the informations coming from an artistic movement!
For any comment or suggestion please feel free to contact me at gvn.magni@gmail.com or the DensityDesign Lab. at info@densitydesign.org.
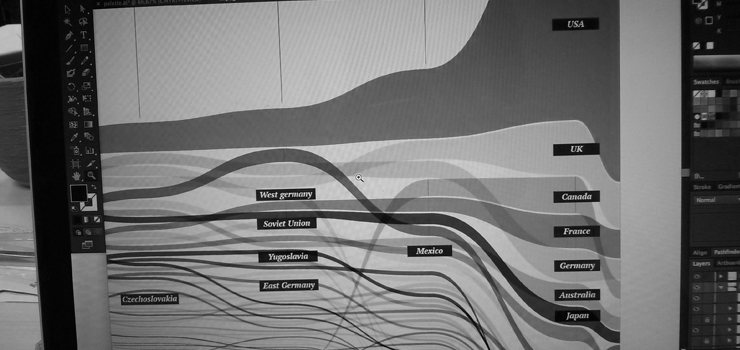
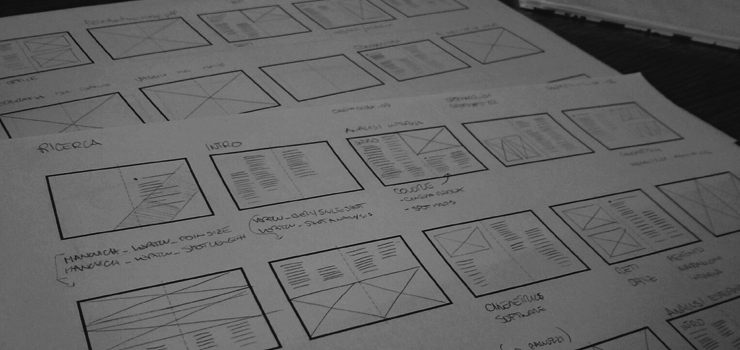
To close this post, some work in progress pictures:
REFERENCES
Ahmed, A., Batagelj, V., Fu, X., Hong, S., Merrick, D. & Mrvar, A. 2007, “Visualisation and analysis of the Internet movie database”, Visualization, 2007. APVIS’07. 2007 6th International Asia-Pacific Symposium onIEEE, , pp. 17.
Bastian, M., Heymann, S. & Jacomy, M. 2009, “Gephi: an open source software for exploring and manipulating networks.”, ICWSM, pp. 361.
Bencivenga, A., Mattei, F.E.E., Chiarullo, L., Colangelo, D. & Percoco, A. “La formazione dellÔÇÖimmagine turistica della Basilicata e il ruolo del cinema”, Volume 3-Numero 6-Novembre 2013, pp. 139.
Caviglia, G. 2013, The design of heuristic practices. Rethinking communication design in the digital humanities.
Cutting, J.E., Brunick, K.L., DeLong, J.E., Iricinschi, C. & Candan, A. 2011, “Quicker, faster, darker: Changes in Hollywood film over 75 years”, i-Perception, vol. 2, no. 6, pp. 569.
Goldfarb, D., Arends, M., Froschauer, J. & Merkl, D. 2013, “Art History on Wikipedia, a Macroscopic Observation”, arXiv preprint arXiv:1304.5629.
Herr, B.W., Ke, W., Hardy, E.F. & B├Ârner, K. 2007, “Movies and Actors: Mapping the Internet Movie Database.”, IV, pp. 465.
Jacomy, M., Heymann, S., Venturini, T. & Bastian, M. 2011, “ForceAtlas2, A continuous graph layout algorithm for handy network visualization”, Medialab center of research.
Jessop, M. 2008, “Digital visualization as a scholarly activity”, Literary and Linguistic Computing, vol. 23, no. 3, pp. 281-293.
Jockers, M.L. 2012, “Computing and visualizing the 19th-century literary genome”, Digital Humanities Conference. Hamburg.
Kittur, A., Suh, B. & Chi, E.H. 2008, “Can you ever trust a wiki?: impacting perceived trustworthiness in wikipedia”, Proceedings of the 2008 ACM conference on Computer supported cooperative workACM, , pp. 477.
Latour, B. 1996, “On actor-network theory. A few clarifications plus more than a few complications”, Soziale welt, vol. 47, no. 4, pp. 369-381.
Manovich, L. 2013, “Visualizing Vertov”, Russian Journal of Communication, vol. 5, no. 1, pp. 44-55.
Manovich, L. 2010, “What is visualization?”, paj: The Journal of the Initiative for Digital Humanities, Media, and Culture, vol. 2, no. 1.
Manovich, L. 2007, “Cultural analytics: Analysis and visualization of large cultural data sets”, Retrieved on Nov, vol. 23, pp. 2008.
Masud, L., Valsecchi, F., Ciuccarelli, P., Ricci, D. & Caviglia, G. 2010, “From data to knowledge-visualizations as transformation processes within the data-information-knowledge continuum”, Information Visualisation (IV), 2010 14th International Conference IEEE, , pp. 445.
Morawetz, N., Hardy, J., Haslam, C. & Randle, K. 2007, “Finance, Policy and Industrial DynamicsÔÇöThe Rise of CoÔÇÉproductions in the Film Industry”, Industry and Innovation, vol. 14, no. 4, pp. 421-443.
Moretti, F. 2005, Graphs, maps, trees: abstract models for a literary history, Verso.
Van Ham, F. & Perer, A. 2009, “ÔÇťSearch, Show Context, Expand on DemandÔÇŁ: Supporting Large Graph Exploration with Degree-of-Interest”, Visualization and Computer Graphics, IEEE Transactions on, vol. 15, no. 6, pp. 953-960.









[…] Blog Search for: Home → Blog → The Big Picture < […]
September 5th, 2014 at 2:30 pmHi Giovanni,
Do you have location data by city within your dataset?
Dr Allan Watson
September 15th, 2014 at 1:06 pmStaffordshire University, UK
Hello Dr. Watson
location’s accuracy is very various, sometimes we have only the country, sometimes we have the complete address. Unfortunately it’s not homogeneous!
Are you working on something similar?
Giovanni Magni
November 10th, 2014 at 3:04 pm