On September 3rd I attended the first International Workshop on Theory and Applications of Process Visualization (TAProViz). The workshop took place in Tallinn, Estonia, within the 10th International Conference on Business Process Management (BPM2012).
The workshop was organized by professors Ross Brown (University of Queensland), Simone Kriglstein and Stefanie Rinderle (University of Vienna).
The workshop constituted also an attempt of the organizers to create a scientific community around the topic of business process visualization: a fairly new research area emerging from Business Process Modeling which is intended to explore new possible approaches and representation models for business process data.
Although the topic has already been part of the BPM research for several years, most process representations have not developed beyond minimal and standardized workflow diagrams, and just lately scholars are discussing the opportunity to introduce principles and techniques typical of information visualization and user interface design.
The workshop was introduced by a keynote by professor Manfred Reichert, who made a point about the increasing amount of process data produced by organizations and brought out the importance of introducing visualization elements to help the users make sense and interact with data.
Many software tools exist on the market to analyze and visualize business process data, nevertheless most of the research community revolves just around disciplines such as computer science and management. Therefore most of the research on the topic so far applies to the standardization of notation languages (such as OMG’s UML), in order to facilitate the development phase.
Hence the exploration of new visualization patterns has not really brought into question. Even if process visualization strongly relates to information visualization and more specifically to communication design, there seem to be no concrete involvement of the design discipline (this also proved by the fact that I was the only designer of the workshop, and probably of the entire conference).
Interesting explorations emerged though from the workshop, particularly from a couple of speeches by Jan Claes (Ghent University) and professor Kazuo Misue (University of Tsukuba). The first one presented a sort of meta-tool for process analysis, which is devoted to examine the way in which business processes are designed, through event logs used as input for PPMCharts (that is charts that describe graphically the process of process modeling).
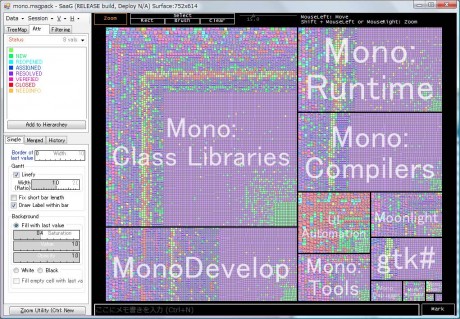
Professor Misue’s speech had an even more designerly vocation, even if starting from a computer science – visual analytics approach. The paper suggest the importance of information visualization techniques to explore activities in large-scale organizations and introduces a panoramic view tool. The analysis tool called SaaG (Series at a Glance) permits the exploration of tasks (here defined as “tickets”) through both a hierarchical and temporal representation. The main view is constituted by a treemap showing the ticket groups structure and a timeline within each ticket (represented by cells) expressed internally through Gantt or Polyline charts.
Despite the absence of an actual design community, the workshop provided several stimuli that revealed to be very useful and productive also for the design discipline.


