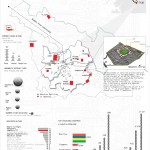
Last November Density Design has been invited by the School of Art and Architecture of Stockholm to organize a workshop of data visualization with the student of a master. They were working on the same topic, the city of Pune in India, trying to understand how to visualize some data about the city.
Students had different background studies, none of them was a graphic designer, mostly architects and artists, so data visualization was a challenge for them all.
Groups had different themes to work on about Pune, different questions to be answered “graphically”:
– How the city of Pune is Green? analyzing the environmental changes of the city,
– How accessible is Pune? exploring the ways of transportation from/to Pune,
– How the IT technology affects the life of the citizens? showing why Pune is the IT Capital of India,
– What is growing in Pune? trying to understand how urban landscape is changing through the city-expansion.
During our week in Stockholm we had some design talks with the students, trying to understand the graphic issues linked with their data about the city of Pune. They had a week to produce a poster, so it has been a nice challenge for everybody. All groups produced very interesting visualizations, if we consider that they had no experience with graphic languages, and especially with information design.


