Second step done!
The groups on the basis of an analytic process have made their diagram, a map.
These artifact should become a plataform to act whitin the complexity of the system whit a design intervention.
Fashion System Centre & Periphery
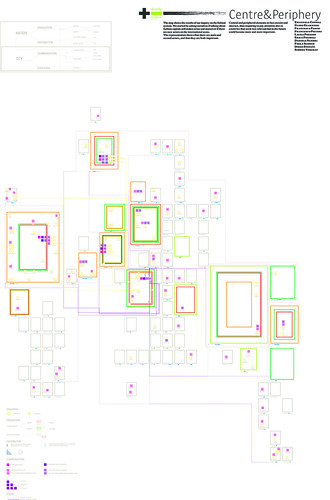
Fashion System – Centre & Periphery, originally uploaded by densitydesign.

density live on stage 07-08, originally uploaded by densitydesign.
The map shows the results of our inquiry on the fashion system. We started by asking ourselves if talking about fashion capitals still makes sense and moreover if there are new actors on the international scene. The representation shows that there are main and second actors, and that they are both important.
Central and peripheral elements in fact coexist and interact, thus requiring to pay attention also to countries that seem less relevant but in the future could become more and more important.
Transport System Italian Infrastructure

Transport System – Italian Infrastructure, originally uploaded by densitydesign.
Analizing the transport system gives back a wide range in quantity and variety of issues and informations available.
We focused our work mainly on the infrastructural system nationwide.
Our survey carefully focuses on mayers and troubles whic new infrastrueures create at local level. It makes a point of laws and normatives that regolate the infrastrueural net development in European countries. As far as it is concerned about the analysis of new infrastrueures increase, we have pointed out how diferent roles may interact.
In other words, how citizens can influence the opinion of the plaintifs that aeually has decisional power in ruling the system.
We have foremost mapped critical areas nationwide. For the BreBeMi highway projee we have identined the main plaintifs and their thinking.
Hospital System From client to Patient
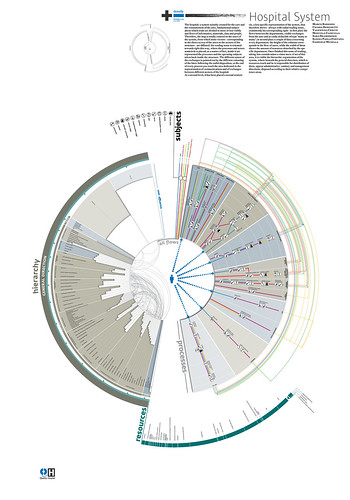
Hospital System – From client to Patient, originally uploaded by densitydesign.
The hospital: a system suitably created for the care and the reinstatement of the user, fundamental subject about which trials are divided to more or less visibly and flows of information, materials, data and people.
Therefore, the map is totally centred on the users of the system, from which some vectors – corresponding to the direct access of the users to the sectors of the structure – are diffused: the reading sense is oriented towards right this way, where the processes and actors semicircle is placed; as a matter of fact, inside it are represented the processes and the operating subjects taken back inside the structure. The different nature of the exchanges is pointed out by the different colouring of the lines: following the radial disposition, at the end of every process you reach the area dedicated to the representation of communications and of exchanges between different sectors of the hospital. At a second level, it has been placed a second semicircle, a less specific representation of the system, that therefore shows – always with radial reading sense, consistently his corresponding right – in first place the flows between the departments, visible exchanges from the user and as easily deducible of type “many to many”; in second place a couple of data concerning every department: the height of the columns corresponds to the flow of users, while the width of them shows the amount of resources absorbed by the specific department. Once finished this sense of reading, taking into consideration a vision more of set of this area, it is visible the hierarchic organization of the system, where beneath the general direction, which is resources reach and he is responsible for distribution of them, appear administrative, sanitary and management directions, disposed according to their relative competence areas.
Media System Integration & convergence

Media System – Integration & convergence, originally uploaded by densitydesign.
“New antennas could convey old froth” (Bertold Brecht).
Our diagram aim to explain the content flow in the italian mediatic system, strarting from the major content producer to the user interfaces. We want to show that the user could be reached by a few editorial groups through various channels, in this way the same content comes to the user in different ways giving him a wrong idea of pluralism. The whole system has been formulatedas an inverted cone which has the producers ring in its base and the user on its top. The upper part put the focus on the editors and their products, this help us to highlight their role inside the system. In the lower part we placed the cone’s development that can individuate the most relevant flows, relations and nodes. The user himself gets into the system as a producer whom is only constrained by the internet distribution platforms, that make the free sharing of contents possible.
Cinematographic System I Soliti Ignoti
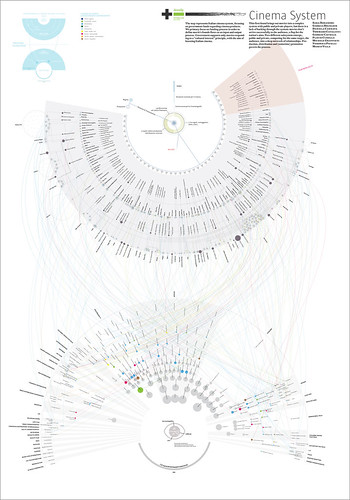
Cinematographic System – I Soliti Ignoti, originally uploaded by densitydesign.
The map represents Italian cinema system, focusing on government funds regarding cinema products.
We primary focus on funding process in order to define movie’s founds flows as an input and output process. Government supports only movies responding to a “cultural interest” principle, with the aim of boosting Italian cinema.
This first found brings out movies into a complex system with public and private players, but there is a lack of backing through the system: movies don’t arrive successfully to the audience, a flop for the nation’s aims.Two different subsystem emerge, public and private, competing for the same target, the audience, into a deep network of relationships. Production, distribution and (sometime) promotion govern the process.
Contemporary Art Valorization mechanisms

Contemporary Art – Valorization mechanisms, originally uploaded by densitydesign.“
For Contemporary Art there are therefore essential requirements needed: something created by someone and a process that results in a social setting, that is an effective frame, something like art.”(Alessandro Dal Lago and Serena Giordano, 2006)
It seems, in fact, that the production and enhancement of artistic is determined only by the logic of the market and the discourse on art. The map represents the system of Contemporary Art in Italy in the last two years from the point of view of twelve breakthrough artist. The actors are grouped by category and differ one from the other according to their level of activity. The flow of interaction between the various actors have different forms: works, money and information; some reports appear in the shade. The representation of the system reveals how the process of defining value of the work is not dependent strictly by artists but involving different actors and how some dynamics of the system remain deliberately hidden.
[…] http://www.politecalab.org/densitydesign/2007/12/05/project-progress-report-02-diagramming/ […]
October 3rd, 2008 at 3:29 pm[…] (the project web site) (the scenario) (the diagram) […]
September 29th, 2009 at 3:20 amProject progress report 02 diagramming.. Awesome 🙂
June 3rd, 2011 at 12:35 pm